Red Light Runners: Analysis of Fatal Crashes at Red Lights
For most drivers and passenger vehicle occupants, it is clear that running a red light is a dangerous and potentially deadly action. Yet, whether as a result of inattention, distraction, or disregard, thousands of people run them every single day in the United States.
When drivers fail to obey traffic control devices, they aren’t just violating the law but they are risking forever altering the lives of those around them, just ask our Oklahoma City car accident attorneys. As these drivers are speeding through the intersection, they put others at a much higher risk of sustaining significant injury than in other types of crashes.
Is this an issue pervasive in all of the nation or are there certain states or areas with a higher-than-average percentage of red-light crashes? Where are people killed most often as a result of a run red light?
With help from the data visualization agency 1Point21 Interactive, we analyzed all red-light fatal crashes between 1997 and 2019. We looked at fatal crashes specifically as NHTSA FARS data is the only complete collision dataset available for the entire U.S.
We identified Red Light Crashes as that involved:
- A red traffic light or flashing signal
- One or more drivers who failed to obey traffic signs, traffic control devices, or traffic officers; failed to observe safety zone*
*Red-light runners may fall in more than one of the following categories.
During the study period, there were a total of 803,176 fatal crashes in the U.S. – 21,007 involved a red-light runner (2.67 percent).
Key Findings
- Crashes with red-light-running drivers are more likely to be fatal for the occupants of other vehicles.
- Compared to drivers in non-red-light-running crashes, red-light runners are most likely to be: older, female, and sober.
- Red light crashes are more likely to occur at midday.
- Washington D.C. has the highest percentage of red light crashes in the U.S. at 5.62.
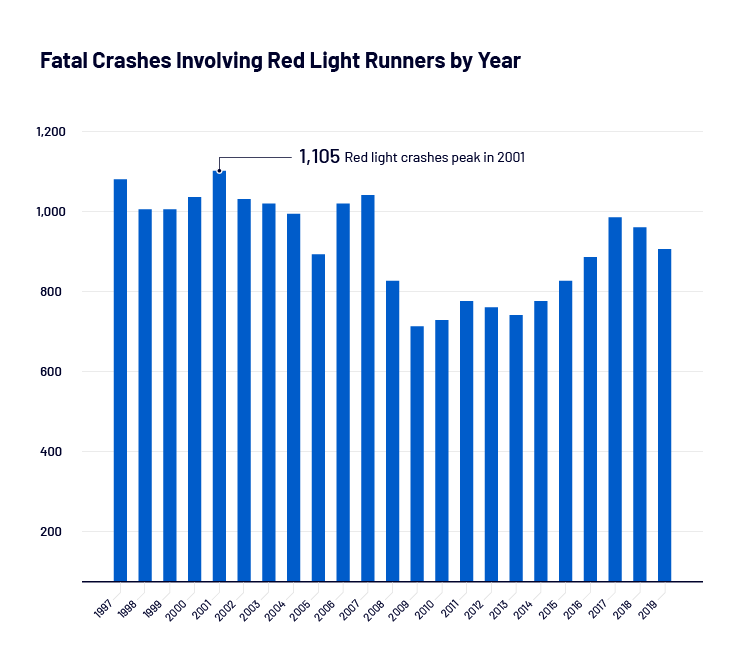
- 2001 was the year with the highest number of red light crashes (1,105).
Red Light Crashes By Year
Red light crashes were on a roughly downward trend from 1997 to 2009, with the lowest number of crashes in 2009 (724). In the following years, they increased, but not as significantly. In 2019, red light crashes made up 2.73 percent of total crashes (909).
Where Do Red Light Crashes Occur?
The map below shows where in the U.S. red light crashes most commonly occur. The map is interactive and reveals additional information if you hover over any state.
The following states have higher percentages of red light crashes than the national average of 2.62. Washington D.C. and Nevada are the worst states when it comes to red light crashes – with more than twice the national average. Compared with other states, Georgia isn’t the worst or the best – it falls slightly under the national average at 2.23.
Top Ten States With Highest Percentages of Red Light Crashes
- Washington D.C. – 5.62 percent of total fatal crashes
- Nevada – 5.41 percent of total fatal crashes
- Arizona – 4.48 percent of total fatal crashes
- Delaware – 4.33 percent of total fatal crashes
- California – 3.89 percent of total fatal crashes
- Colorado – 3.65 percent of total fatal crashes
- Maryland – 3.59 percent of total fatal crashes
- Texas – 3.30 percent of total fatal crashes
- Illinois – 3.29 percent of total fatal crashes
- Indiana – 3.26 percent of total crashes
Top Ten States With Least Percentages of Red Light Crashes
- North Dakota – 0.47 percent of total fatal crashes
- Montana – 0.52 percent of total fatal crashes
- Wyoming – 0.57 percent of total fatal crashes
- Vermont – 0.59 percent of total fatal crashes
- Arkansas – 0.62 percent of total fatal crashes
- South Dakota – 0.63 percent of total fatal crashes
- New Hampshire – 0.67 percent of total fatal crashes
- Maine – 0.75 percent of fatal crashes
- Idaho – 0.95 percent of fatal crashes
- West Virginia – 0.99 percent of fatal crashes
Table: Fatal Crashes Involving Run Red Lights By State
*Rank is determined by the percentage of total fatal crashes that involved a run red light. Ties were broken by count of red light crashes.
| Rank | State | Red Light Crashes | Total Crashes | Percent Red Light |
|---|---|---|---|---|
| 1 | District of Columbia | 45 | 801 | 5.62% |
| 2 | Nevada | 370 | 6839 | 5.41% |
| 3 | Arizona | 903 | 20137 | 4.48% |
| 4 | Delaware | 111 | 2561 | 4.33% |
| 5 | California | 2931 | 75397 | 3.89% |
| 6 | Colorado | 443 | 12135 | 3.65% |
| 7 | Maryland | 432 | 12046 | 3.59% |
| 8 | Michigan | 828 | 23265 | 3.56% |
| 9 | Texas | 2392 | 72569 | 3.30% |
| 10 | Illinois | 808 | 24547 | 3.29% |
| 11 | Indiana | 580 | 17806 | 3.26% |
| 12 | Utah | 181 | 5803 | 3.12% |
| 13 | Florida | 1891 | 61805 | 3.06% |
| 14 | New Jersey | 427 | 14030 | 3.04% |
| 15 | Alaska | 45 | 1594 | 2.82% |
| 16 | Nebraska | 139 | 5037 | 2.76% |
| 17 | New York | 739 | 27697 | 2.67% |
| 18 | Pennsylvania | 765 | 29181 | 2.62% |
| 19 | Connecticut | 161 | 6244 | 2.58% |
| 20 | Minnesota | 257 | 10121 | 2.54% |
| 21 | Ohio | 634 | 25519 | 2.48% |
| 22 | North Carolina | 701 | 30464 | 2.30% |
| 23 | Georgia | 692 | 30991 | 2.23% |
| 24 | Kentucky | 366 | 17030 | 2.15% |
| 25 | Alabama | 430 | 20729 | 2.07% |
| 26 | Louisiana | 355 | 17608 | 2.02% |
| 27 | Wisconsin | 280 | 13926 | 2.01% |
| 28 | Washington | 236 | 11746 | 2.01% |
| 29 | Hawaii | 50 | 2534 | 1.97% |
| 30 | Missouri | 380 | 20617 | 1.84% |
| 31 | Tennessee | 424 | 23695 | 1.79% |
| 32 | Rhode Island | 28 | 1560 | 1.79% |
| 33 | South Carolina | 358 | 20427 | 1.75% |
| 34 | Oregon | 153 | 9007 | 1.70% |
| 35 | Massachusetts | 143 | 8623 | 1.66% |
| 36 | Kansas | 144 | 8894 | 1.62% |
| 37 | Virginia | 280 | 18121 | 1.55% |
| 38 | New Mexico | 120 | 8290 | 1.45% |
| 39 | Mississippi | 208 | 15875 | 1.31% |
| 40 | Iowa | 96 | 8122 | 1.18% |
| 41 | Oklahoma | 160 | 14490 | 1.10% |
| 42 | West Virginia | 73 | 7401 | 0.99% |
| 43 | Idaho | 47 | 4948 | 0.95% |
| 44 | Maine | 27 | 3581 | 0.75% |
| 45 | New Hampshire | 18 | 2688 | 0.67% |
| 46 | South Dakota | 19 | 3013 | 0.63% |
| 47 | Arkansas | 76 | 12197 | 0.62% |
| 48 | Vermont | 9 | 1533 | 0.59% |
| 49 | Wyoming | 17 | 2968 | 0.57% |
| 50 | Montana | 24 | 4612 | 0.52% |
| 51 | North Dakota | 11 | 2352 | 0.47% |
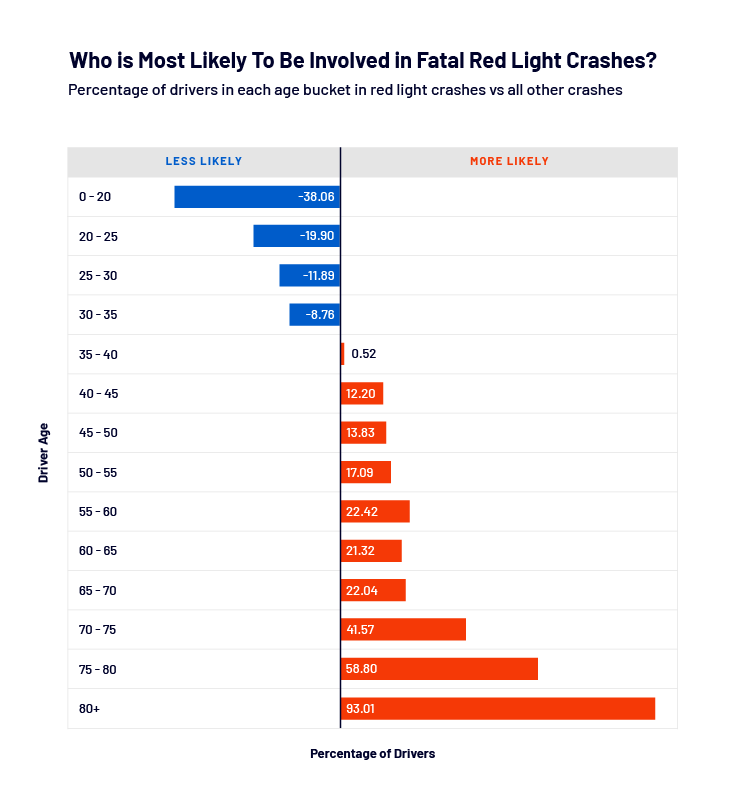
Who Is Involved in Red Light Crashes?
In general, young men are the most likely to be involved in all fatal crashes, including red light crashes. However, more interesting is the comparison between red-light runners and other drivers in fatal crashes. When compared to drivers in non-red-light-running fatal crashes, red-light runners are:
- More likely to be older: Drivers over the age of 80 make up more than four percent of red-light runners, but only 2 percent of drivers in other types of fatal crashes.
- More likely to be female: Female drivers are 36 percent more likely to be involved in a fatal red light crash, while men are 1o percent less likely.
- More likely to be sober: Drunk and buzzed drivers only make up 13 percent of red-light runners, instead of 25 percent of drivers in other types of fatal crashes.
How Buzzed or Drunk Are Red Light Runners?
If blood alcohol testing was conducted, then the data was used in this study. If it was not provided, it was taken from statistically imputed estimates of BAC. Defining Terms: Drunk: BAC over 0.08 Buzzed: BAC 0.01-0.08 Sober: BAC under 0.01 As seen earlier, the majority of red-light runners – 86 percent – were not intoxicated. Three percent of drivers were buzzed and ten percent were legally drunk when they blew through a red light. Compared to other types of fatal crashes, half the number of drivers were legally drunk in red light crashes (20 percent vs. 10 percent, respectively).
| Inxotication | Red Light Crashes | All Other Crashes | More or Less Likely? |
|---|---|---|---|
| Buzzed | 1,338 | 86,793 | -32% less likely |
| Drunk | 4,643 | 420,630 | -52% less likely |
| Sober | 40,003 | 1,512,687 | 16% More likely |
When Do Red Light Crashes Most Likely Occur?
Red light crashes are most likely to occur during the daytime. 43 percent of red light crashes happen between 8 a.m. and 4 p.m. (as compared to 34 percent of other types of crashes).
Crashes by Time of Day
| Time | Red Light Crashes | All Other | More or Less Likely? |
|---|---|---|---|
| Midnight to 4am | 2,283 | 106,297 | -20.84% less likely |
| 4am – 8am | 2,691 | 98,554 | 0.63% more likely |
| 8am – Noon | 4,385 | 105,255 | 53.54% more likely |
| Noon – 4pm | 4,595 | 153,204 | 10.54% more likely |
| 4pm – 8pm | 3,654 | 169,325 | -20.47% less likely |
| 8pm – Midnight | 2,591 | 111,812 | -14.60% less likely |
Why This Study Matters: Preventing Red Light Crashes
At Dan Daivs Law, our Oklahoma City personal injury lawyers see the irreparable consequences red-light crashes have on the residents of Oklahoma, and we believe the topic requires more attention. According to the National Highway Traffic Safety Administration (NHTSA), red-light running is a form of aggressive driving (defined as when “an individual commits a combination of moving traffic offenses so as to endanger other persons or property”).
Most of the time, drivers run red lights when they are in a hurry or the signal has just turned red and they have misjudged the timing. Red lights can feel like such a pain when we are in a rush to reach our destination, but remember that they are vital in maintaining the flow of traffic and keeping drivers, pedestrians, and cyclists safe on the road. Practice the following tips to stay safer on the road:
- Pause after the light turns green: Practice defensive driving. After the light turns green, pause and count to three. Look in all directions and make sure the intersection is clear before moving through it.
- Drive at the speed limit: When you drive at a safe speed, you have the space and time to stop safely before entering an intersection.
- Decide to stop on red: Instead of running through a red light, just to save a few seconds, choose to make the safer choice for yourself and those around you. Make it a habit to stop at the red light – don’t risk your life or someone else’s by attempting to speed through it.
Methodology and Fair Use
This study is based on 1975-2019 fatal crash data from the National Highway Traffic Safety Administration (NHTSA). We filtered for crashes when there was:
- A traffic beacon or flashing signal (at the accident level pre-2009, vehicle level post-2009)
- One or more drivers had a contributing factor of Failure to Obey Traffic Signs, Traffic Control Devices or Traffic Officers, Failure to Observe Safety Zone
If you would like to republish any of the data, images, or findings included, please provide credit by linking to this page.